The exams are done. Finally, you can actually see sunlight again. But if you’ve got your sights set on a career in finance, the next hurdle is already here: landing a job in Equity Research.
Your CA qualification is a huge plus, no doubt. You’ve got the accounting chops. But an Equity Research (ER) interview is a different beast entirely. It’s not about auditing what’s already happened; it’s about building a financial model to predict what’s going to happen next. You’re basically a financial fortune-teller.
This guide will walk you through the key equity research interview questions you’ll get hit with. No fluff, just the technical stuff, valuation methods, and a real-world case study to make sure you’re prepared.
What is Equity Research?
Before we get into the tough questions, let’s make sure we’re on the same page about the job itself. Knowing what an equity research analyst actually does will help you shape your answers and show the interviewer you’re not just winging it.
At its heart, an equity research analyst is a financial detective. You dig into public companies, build financial models to predict how they’ll perform, and then make a recommendation: should clients “Buy,” “Sell,” or “Hold” their stock?

Your CA skills in tearing apart financial statements are a massive advantage. You already speak the language. The big shift is the perspective. Accounting looks backward. Equity research looks forward. That’s why the following questions are so important, as they test if you can make that jump from historian to forecaster.
Foundational Technical Questions
Think of these as the gatekeepers. Interviewers use them as a quick check to see if you have the core accounting knowledge to even be in the room. If you stumble here, it’s a pretty big red flag. Nailing these shows you have the foundation to build on.
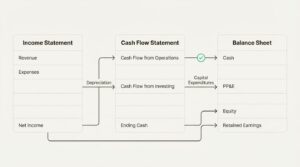
How are the three financial statements linked?
This is the classic opener. They want to see if you can think about a business as a whole, not just a bunch of separate reports.
First, a quick refresher on the three financial statements:
- The Income Statement: Shows profitability over a period (like a quarter or year). It’s your revenue minus expenses, giving you the bottom line: Net Income.
- The Balance Sheet: This is a snapshot in time, showing what a company owns (Assets) and what it owes (Liabilities and Equity). It always has to balance: Assets = Liabilities + Equity.
- The Cash Flow Statement: This report takes the Net Income from the Income Statement and adjusts it to show the actual change in the company’s cash.
The Core Link: Net Income and Cash Flow
The real trick is understanding how they all connect. Here are the main links:
- Net Income: This is the big one. The bottom line of the Income Statement is the very first line in the Cash Flow from Operations section. It also gets added to Retained Earnings under Shareholders’ Equity on the Balance Sheet. This is the central link between statements.
- Depreciation: This is a non-cash expense on the Income Statement. Since no cash actually left the building, you add it back to Net Income on the Cash Flow Statement. On the Balance Sheet, Accumulated Depreciation lowers the value of Property, Plant & Equipment (PP&E).
- Capital Expenditures (Capex): When a company buys a new factory, that’s Capex. It doesn’t show up on the Income Statement. Instead, it’s a use of cash under the Cash Flow from Investing section, and it increases the PP&E account on the Balance Sheet.
- Working Capital: Changes in current assets (like Accounts Receivable) and current liabilities (like Accounts Payable) on the Balance Sheet are reflected as adjustments in the Cash Flow from Operations section. For instance, if your Accounts Receivable increased, you made sales but haven’t collected the cash yet, so that reduces your cash flow.
- Financing Activities: If a company issues new stock or takes on debt, that debt balance goes up on the Balance Sheet, and the cash it received shows up in the Cash Flow from Financing section.
- Ending Cash: The final cash balance calculated on the Cash Flow Statement must be the same as the cash balance shown on that period’s Balance Sheet. If they don’t match, something’s wrong in your model.
What is the difference between enterprise value and equity value?
This question checks if you understand what you’re actually valuing. It’s a simple idea, but it’s easy to get twisted under pressure.
Here’s a simple way to think about it:
- Equity Value is the price you’d pay for a house. It’s the sticker price, also known as market capitalization.
- Enterprise Value is the total cost to buy the entire business. It’s the price of the house plus the mortgage and any other debts you have to take over.
The formula is:
Enterprise Value = Equity Value + Net Debt (Total Debt – Cash) + Preferred Stock + Minority Interest
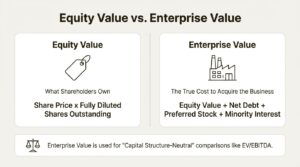
But why do we bother with this? Analysts almost always use Enterprise Value for valuation multiples (like the famous EV/EBITDA). According to Investopedia, this is because it’s “capital structure-neutral.” Basically, it ignores how a company is financed (how much debt it has) and its tax situation. This gives you a much fairer comparison between two companies that might have very different debt levels or tax rates. It lets you compare their core operations on an apples-to-apples basis.
Practice giving answers confidently with our Interview Bot.
Questions on Valuation Techniques
Okay, you’ve passed the first hurdle. Now for the part where you really have to think like an analyst. Anyone can memorize a definition. The best candidates can explain the logic behind valuation methods and talk about their pros and cons.
How would you walk an interviewer through a DCF?
DCF stands for Discounted Cash Flow. It’s considered the gold standard of valuation, and you have to know how it works. Don’t just list the steps; explain why you’re doing each one.
The core idea is pretty straightforward: A company’s value today is the sum of all the cash it will generate in the future, with that future cash discounted back to what it’s worth today.
Step-by-Step Framework to Explain a DCF in an Interview
Here’s how you’d walk someone through it, just as valuation experts would:
- Forecast Free Cash Flow (FCF): First, you project the company’s unlevered free cash flow for about 5-10 years. “Unlevered” simply means the cash flow available to all investors (both debt and equity holders) before you account for interest payments. This forecast is built on your assumptions about revenue growth, margins, taxes, and investments.
- Calculate Terminal Value: A company doesn’t just vanish after 10 years. You have to estimate its value for all the years after your forecast period. This is the Terminal Value. You can do this in two main ways: the Gordon Growth Method (assuming cash flows grow at a slow, steady rate forever) or the Exit Multiple Method (assuming the company is sold at the end of the period for a multiple like 10x EBITDA).
- Discount to Present Value: Money in the future isn’t worth the same as money today (because of risk and what you could have done with it instead). You have to discount both the projected FCFs and the Terminal Value back to today’s value. The discount rate you use is the Weighted Average Cost of Capital (WACC). Add all these present values up, and you get the company’s Enterprise Value.
- Calculate Equity Value: The DCF gives you the Enterprise Value. To find the Equity Value (what’s left for shareholders), you just work backwards from the formula we talked about earlier: subtract net debt, preferred stock, and minority interest from the Enterprise Value.

P/E vs. EV/EBITDA: Which multiple is better?
This is a classic trick question. The right answer isn’t “one is better.” It’s, “it depends on the situation.” Both are ways of comparing a company’s value to its peers, but they measure different things and have their own issues.
P/E Ratio (Price-to-Earnings):
- Use Case: It’s best for mature, consistently profitable companies with stable earnings, like a big consumer goods company.
- Drawback: Its biggest flaw is that it’s an equity multiple, meaning it’s heavily affected by a company’s debt and tax rate. A company with a lot of debt will have higher interest expenses, which lowers its net income (the “E” in P/E) and can make its P/E ratio look deceptively low. This makes it tough to compare across companies with different financing strategies.
EV/EBITDA (Enterprise Value-to-EBITDA):
- Use Case: This is usually the go-to multiple for comparing companies with different debt levels, tax rates, or depreciation policies. Because it starts with Enterprise Value and looks at earnings before interest, taxes, depreciation, and amortization, it gives a cleaner look at core business performance.
- Drawback: It has a huge blind spot: it ignores capital expenditures (capex) and changes in working capital. A company in a capital-heavy industry, like manufacturing, might have massive investment needs that EBITDA doesn’t show. As Investopedia notes, this can make a business that needs a lot of cash to keep running look deceptively cheap.

How to Handle Zomato’s Valuation
This is where things get real. Interviewers love asking about high-growth, unprofitable tech companies like Zomato because it tests your business sense, not just your ability to plug numbers into a formula.
First, acknowledge the problem right away. You can’t use a P/E ratio because earnings are negative. A standard DCF is also difficult because projecting cash flows for a company that’s still losing money is highly speculative. The valuation here is all about the potential for huge future cash flows, not current profits.
Valuation, especially for a company like this, is a story backed by numbers. As the famous valuation expert Aswath Damodaran says, valuation is the bridge between a story and the financials. Your “story” for Zomato needs a clear plot about how it will become profitable. It’s not just about crunching numbers; it’s about defending your assumptions.
Key Assumptions Driving Zomato’s Valuation
Your valuation will depend entirely on your assumptions for a few key things:
- Total Addressable Market (TAM): How big can the Indian food and grocery delivery market actually get? This is the ceiling for your valuation.
- Market Share: Zomato is in a dogfight with competitors like Swiggy. Can it keep or grow its market share? Your assumption here is a massive value driver.
- Revenue “Take Rate”: This is the slice of the total order value that Zomato gets to keep as revenue. It’s always under pressure from competition.
- Operating Margins: This is the big one. When will the company become profitable? You have to build a narrative for how they get there: through scale, new services, or lower marketing costs. For example, a recent analysis showed Zomato’s first quarterly profit in 2023 was mostly from interest income on its IPO cash, not from its core business. A good analyst has to see through that.
With this story in mind, a DCF is still your main tool, even if it’s sensitive. For relative valuation, you have to be creative. Instead of looking at profits, you’d use multiples like EV/Sales or, even better, EV/Gross Order Value (GOV).
Why Knowing Financial Modeling Is Essential
Getting into equity research means bridging the gap between your CA theory and the real-world skills of a financial analyst. As you’ve seen, just knowing the definitions won’t cut it. You need to apply these concepts to messy, real-world companies like Zomato and handle accounting curveballs without breaking a sweat.
Honestly, trying to answer these questions well without ever having built a financial model is tough. Reading about a DCF is one thing, but building one from the ground up is a completely different experience.
If you’re ready to stop memorizing and start doing, you can learn these techniques and build your first pro-level model in our 14-day Financial Modeling & Valuation Course. This is where your finance career really begins.
Also read: ATS Resume Guide for CA Freshers