
Does the thought of another month-end MIS report in Excel make you want to hide under your desk? We’ve all been there. You spend hours, sometimes days, wrestling with VLOOKUPs, pivot tables, and endless spreadsheets, just to manually piece together the same reports. It’s tedious, mind-numbing, and one tiny copy-paste error can throw the whole thing off. The cycle repeats every single month, leaving you feeling more like a data entry clerk than a strategic finance professional.
What if you could break that cycle? This is where Business Intelligence (BI) tools come in. They’re designed to automate all that manual work, connect directly to your data sources, and turn messy spreadsheets into clean, interactive dashboards. Instead of just reporting the numbers, you can start analyzing them, uncovering insights, and providing real strategic value. You can finally move from a compliance role to becoming a trusted advisor.
The two biggest names in the game are Microsoft Power BI and Tableau. But which one is right for you? This guide cuts through the noise and compares them from the perspective of a chartered accountant. We’ll look at the things that actually matter to finance pros: how easy they are to pick up if you live in Excel, how much they cost, and how well they handle the nitty-gritty of financial reporting.
What is Power BI?

Think of Power BI as Excel on steroids. It’s Microsoft’s business analytics tool designed to take all your raw data from various sources and transform it into insightful, interactive dashboards and reports.
For anyone who’s spent years mastering Excel, jumping into Power BI feels surprisingly familiar. It’s built on many of the same foundations. The data transformation engine, Power Query, is the exact same one you find in modern Excel. Its formula language, DAX (Data Analysis Expressions), is basically an advanced version of the Excel formulas you already use. As one user put it, Power BI is essentially “Power Query and Power Pivot in a new shell”.
Because it’s a Microsoft product, its biggest advantage is how well it integrates with the entire ecosystem. It connects seamlessly with Excel, SharePoint, Teams, and Azure. For any CA firm that’s already running on Microsoft 365, adding Power BI to the mix is a pretty straightforward decision.
What is Tableau?

Tableau is a giant in the world of data visualization. It’s famous for its incredibly user-friendly, drag-and-drop interface that lets you create stunningly beautiful and highly customized charts and graphs. If you’ve ever seen a really cool, interactive data visualization online, there’s a good chance it was made with Tableau.
It’s widely praised for its flexibility and powerful “front-end” capabilities. This makes it a favorite among full-time data analysts and data scientists who need to dig deep into complex datasets and explore them from every possible angle. It’s all about visual discovery and finding the story hidden within your data.
It’s also worth noting that Tableau is owned by Salesforce. This is a huge plus for companies that are heavily invested in the Salesforce CRM ecosystem, as it allows for deep and seamless integration between sales and operational data.
Data integration and ease of use
A BI tool is only useful if you can actually get your data into it and figure out how to use it without a degree in computer science. For finance departments, this means connecting to core financial systems and having a learning curve that a CA, not a data scientist, can handle.
Connectivity to your financial data
Power BI
This is an area where Power BI offers distinct advantages for accountants. It has native, one-click connectors to the tools you use every day, like Excel workbooks, folders of CSVs, and SQL Server databases. Since most accounting departments are built on a foundation of Microsoft products, this integration feels completely natural.
Power BI is also deeply woven into Microsoft 365. This means you can view reports in OneDrive and SharePoint, right alongside your other files. It creates a single, unified workspace for firms that already live and breathe in the Microsoft world. You don’t have to jump between different apps; your financial dashboards are right where you need them.
Tableau
Tableau also has a long list of data connectors and can pull data from almost anywhere. It’s particularly strong when it comes to connecting to diverse, non-Microsoft data sources like cloud applications, big data platforms, and various databases. As mentioned, its tight integration with Salesforce makes it the top choice for combining sales data with other business metrics.
However, for a professional who spends 90% of their day in Excel, connecting to standard accounting software or even just a folder of spreadsheets can feel less intuitive compared to Power BI. It works perfectly well, but the connection process may feel less seamless compared to Power BI’s integration within the Microsoft ecosystem.
The learning curve
Power BI
For a CA, the learning curve for Power BI is often more approachable. The interface and logic are a direct extension of what you already know from Excel. If you’ve ever used Power Query to clean up messy data or written a complex formula, you’re already halfway there. You’ll be using the same Power Query interface for data preparation and DAX for calculations. As another user on Reddit wisely noted, if you know Power Query and Power Pivot, you’ll “feel more at home than Tableau”. It’s about building on your existing skills, not starting from scratch.
Tableau
Tableau is often praised for being intuitive, particularly for visual exploration. Its drag-and-drop canvas is fantastic for quickly creating charts. However, the underlying logic and its custom calculation language are very different from the cell-based world of spreadsheets. You have to learn concepts like dimensions, measures, and aggregations in a new context, which can feel foreign to someone accustomed to the structure of Excel. The learning curve isn’t impossible, but it’s definitely steeper for a typical CA.
While Power BI is more accessible, the fastest way to get up to speed is with guidance. A structured course designed for finance professionals can cut down the learning time dramatically. Our Data Analytics course helps CAs like you go from wrestling with raw data to building impressive financial dashboards in a matter of weeks, not months.
Financial reporting and analysis
The end goal for any CA is to produce accurate, easy-to-understand, and often standardized financial reports. The right tool depends on whether your main job is creating structured monthly reports or conducting creative, open-ended data exploration.
Building standard financial reports
Power BI
Power BI is built for creating the kind of structured, pixel-perfect financial reports that boards and stakeholders expect. Think Profit & Loss statements, Balance Sheets, and Cash Flow analyses. Its features are perfectly suited for the repeatable, templated nature of financial reporting. You can set up your data model once and have your monthly reports refresh automatically with the click of a button.
Furthermore, its formula language, DAX, allows for incredibly powerful financial modeling. You can create complex, custom KPIs like Year-over-Year Growth, Gross Margin Percentage, or Debtor Days directly within your report, providing deep insights that go far beyond a standard Excel summary.
Tableau
Tableau’s biggest strength is in creative and exploratory visualization. It’s a leading tool when you need to build a highly custom dashboard for ad-hoc analysis, like figuring out why sales in a certain region suddenly dropped. While you can certainly create financial reports in Tableau, its design freedom can present certain challenges. Enforcing the strict formatting and standardized layouts required for board-level financial statements can be more difficult than in Power BI. Its real power is unleashed when you’re exploring data, not when you’re trying to fit it into a rigid template.
Advanced analysis and AI features
Power BI
Microsoft has been investing heavily in AI, and it shows in Power BI. Features like Copilot are a huge help for CAs. You can now create reports and write DAX queries just by typing what you want in plain English. For example, you could ask, “Show me the top 5 expenses by department for the last quarter,” and it will generate the visual for you. This makes advanced analysis accessible to everyone, allowing you to find the key drivers behind financial variances without needing a data science degree.
Tableau
Tableau isn’t ignoring AI either. It has sophisticated analytical features and its own AI-driven platform called Tableau Next, which focuses on “agentic analytics.” These tools are designed to help users perform deep statistical analysis and build predictive models. However, these capabilities are generally more aligned with the needs of a specialized data analyst or data scientist. For a CA whose main goal is to automate the MIS report and track performance against budget, these features might be more than you need.
Here’s a quick breakdown of how they compare for an accountant:
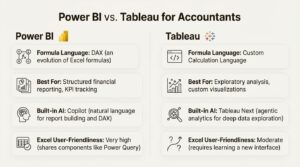
| Feature | Power BI | Tableau |
|---|---|---|
| Formula Language | DAX (an evolution of Excel formulas) | Custom Calculation Language |
| Best For | Structured financial reporting, KPI tracking | Exploratory analysis, custom visualizations |
| Built-in AI | Copilot (natural language for report building and DAX) | Tableau Next (agentic analytics for deep data exploration) |
| Excel User-Friendliness | Very high (shares components like Power Query) | Moderate (requires learning a new interface) |
Practical considerations
Technical features are great, but at the end of the day, practical things like cost, collaboration, and career progression are what really matter for you and your firm.
Pricing and licensing explained
This is often a key factor, and there’s a clear difference between the two.
Power BI
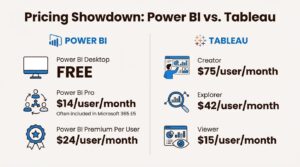
- Power BI Desktop: This is the authoring tool where you build your reports, and it is completely free. You can download it and start learning today without paying a cent.
- Power BI Pro: To share and collaborate on reports, you need a Pro license. This is priced at $14 per user/month (paid annually). Crucially, Power BI Pro is often included at no extra charge in Microsoft 365 E5 subscriptions, which many medium and large firms already have. You might already have access to it and not even know it.
- Power BI Premium Per User: For larger organizations needing more advanced features, this license costs $24 per user/month (paid annually).
Tableau
- Creator: To build and publish reports, you need a Creator license, which starts at $75 per user/month (billed annually). This is the minimum requirement for anyone developing dashboards.
- Explorer: For users who need to interact with and edit existing dashboards, the license starts at $42 per user/month.
- Viewer: For users who only need to view and interact with published dashboards, the license starts at $15 per user/month.
Verdict: For many CAs and accounting firms, Power BI presents a more cost-effective option. The ability to start for free with Desktop and the high likelihood that a firm already has Pro licenses through Microsoft 365 makes it incredibly accessible. Tableau’s entry point is significantly higher, making it a bigger investment.
Collaboration and career path
Collaboration
Sharing reports is key, and again, Power BI’s integration offers advantages in a typical corporate environment. You can publish reports to the Power BI Service and then seamlessly embed them in Microsoft Teams channels. This allows you to discuss the financial data within the collaboration tools your team already uses every day, keeping the conversation in context. Tableau also has excellent sharing capabilities through Tableau Server or Tableau Cloud, but it exists as a separate platform rather than an integrated part of your daily workflow.
Career Impact
Learning Power BI is an immediate, practical skill that will pay dividends in your current role. It directly solves the pain of manual reporting, frees up your time for more valuable analysis, and allows you to demonstrate tangible value to your boss almost instantly. It’s an evolution of your core accounting skills.
Learning Tableau is also an incredibly valuable skill, but it often positions you for a different career path. It’s a tool that can help you transition into a data analyst or data scientist role, as it’s primarily a specialized visualization tool. If your goal is to become a better, more efficient, and more strategic CA, Power BI is the most direct route.
Seeing is believing. To get a real sense of how Power BI can transform your financial reporting from tedious manual work into an automated, insightful process, check out this practical walkthrough. It demonstrates how to build the exact kind of reports that can elevate your role.
Which tool is right for accountants?
So, after all that, what’s the final call?
For the vast majority of chartered accountants working in corporate finance or accounting firms, Power BI is the logical and strategic starting point. It’s more cost-effective, builds directly on your existing Excel skills, and is perfectly designed for the structured financial reporting you do every day. Its deep integration with the Microsoft ecosystem means it will slot right into your existing workflows.
Tableau is a fantastic tool, and for deep, exploratory data visualization, it’s one of the best in the business. But it’s a specialized instrument. It’s the right choice for dedicated data analysts or for CAs who are looking to pivot their careers entirely towards data science.
If your goal is to stop the madness of manual MIS reports, gain deeper insights from your financial data, and add more strategic value to your organization, learning Power BI will deliver the fastest and most tangible return on your time.
Start your data analytics journey today
Ready to stop wrestling with spreadsheets and start driving decisions with data? Enroll in our Tableau course, designed specifically for finance professionals.
Frequently Asked Questions
Q.1 How steep is the learning curve for an accountant moving from Excel to Power BI?
A: The learning curve is much friendlier than other BI tools. Power BI uses components like Power Query and a formula language (DAX) that are direct extensions of what you already know from Excel. This makes the transition smoother and more intuitive for finance professionals.
Q.2 What are the main advantages of Power BI for accountants?
A: The primary advantages are its seamless integration with the Microsoft ecosystem (Excel, Teams, SharePoint), its lower cost, and its design, which is perfectly suited for structured financial reporting like P&L statements and balance sheets.
Q.3 Is Power BI free to start with?
A: Yes, the report-building tool, Power BI Desktop, is completely free to download and use. You only need a paid license (Power BI Pro) when you want to share and collaborate on reports with others.
Q.4 Can Power BI create standard financial statements?
A: Absolutely. Power BI is exceptionally good at creating the structured, pixel-perfect financial reports that boards and stakeholders require. You can build templates for these reports that refresh automatically with new data.
Q.5 How does Power BI integrate with Microsoft products?
A: Power BI is deeply integrated into Microsoft 365. You can connect to data in Excel and SharePoint, and you can view and interact with your reports directly within Microsoft Teams and OneDrive, creating a unified workspace.
Q.6 Will learning Power BI help my accounting career?
A: Yes, it’s a highly practical skill that allows you to automate manual reporting, freeing up your time for more strategic analysis. This demonstrates immediate value and helps you transition from a compliance-focused role to a strategic business partner, opening up new career opportunities.
Also read: Ace Behavioral Interviews With the Star Method (Big 4 Guide)